

A box plot is a graphical representation of data that shows the distribution of numerical data in a way that facilitates comparisons between variables or across different groups of data. Excel provides a built-in function to create box plots, which can be used to compare multiple sets of data. In this guide, we will be learning how to create a box plot in excel, and read till the end.
What Is A Box Plot In Excel?
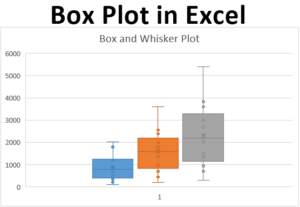
A box plot is a graphical representation of data that uses rectangles to show the distribution of a data set. The rectangles are positioned so that the bottom of the rectangle represents the lower quartile, the top of the rectangle represents the upper quartile, and the middle of the rectangle represents the median. Box plots can be used to compare data sets, find outliers, and determine the symmetry of a data set.
Learn More: Bullet Points In Excel- Create, Format, Edit, Move & Delete
How Box Plot Displays Data?
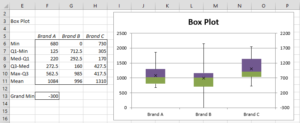
A box plot is a graphical way of displaying data based on a five-number summary. The five-number summary consists of the minimum value, first quartile, median, third quartile, and maximum value. The minimum and maximum values are the extremes, the first and third quartiles are the lower and upper hinges, and the median is the center.

The box plot displays the data in five sections: the minimum value, first quartile, median, third quartile, and maximum value. Each section is represented by a line called Whisker, and the sections are connected by four lines. The length of each line represents the range of values in each section. The lines are spaced so that they represent the distribution of the data.
What Are The Steps To Create A Box Plot In Excel?
A box plot is a graphical representation of data that shows the distribution of values in a dataset. Box plots are often used to compare distributions of data between groups of data.
To create a box plot in Excel for Microsoft 365, you will need to:
- Select the data that you want to plot.
- Click the Insert tab on the ribbon.
- Click the Box Plot button in the Charts group.
- Choose the desired options for the box plot.
- Click OK.
Also Read: How To Run Microsoft Office On A Chromebook | Latest Guide
Your box plot will now be inserted into the worksheet.
How To Format A Box Plot In Excel?
Box plots are a great way to visualize data in Excel.
- To format a box plot in Excel, first, select the data that you want to plot. Then, click the “Insert” tab and choose the “Box Plot” option from the “Charts” drop-down menu.
- Once you’ve inserted the box plot, you can customize it to your liking. To do this, simply click on the plot and then select the “Format” tab from the ribbon. From here, you can change the fill color, line color, and other options.
- One thing to keep in mind when formatting box plots is that you’ll want to make sure the data is organized in a specific way. For example, each data point should be in its own column, and each column should be labeled. Additionally, you may want to add a title and/or axis labels to your plot.
By following these steps, you can easily format a box plot in Excel.
Conclusion
To summarize, The box plot is a type of chart that is used to represent a distribution. The box plot is very popular in business and is used to give a snapshot of the performance of an individual or a team. The box plot is made up of a series of boxes that are organized in order from smallest to largest. The chart is named after the box shapes it uses to represent points. The smallest point in the series is the bottom of the box, the middle of the series is represented by the line on top of the box, and the largest point is represented by the top of the box. If you have any questions about box plots or would like to know more about our consulting services, please contact us at any time. Thanks for reading and enjoy your day!